Before starting I’d just like to say that this post is not a cookbook of the algorithms that will allows to handle time series data. I will cite some but they are too many and list them is not the prupose, this article is more a REX (Return on Experience) on what I faced and how to simply avoid some basic issues.
<p class=”has-normal-font-size” value=”<amp-fit-text layout=”fixed-height” min-font-size=”6″ max-font-size=”72″ height=”80″>Repetition is everywhere. Despite this, it was not possible to repeat a temporal object before 1877 and the invention of the phonograph by Thomas Edison. Even the type of music called “modern classical” that is explicitly made to avoid repetitions has some in it. Moreover, if you artificially add some repetitions in this music, human find it more enjoyable (it has to be said that contemporary classical music is quite hard to ear). Brain is prime to search for meaning and patterns in the world. Repetition infer meanings. This has to be linked to how the brain works. Indeed, the information in the brain comes from neurons that have an electrical activity. Recordings of this activity using EEG techniques and analyses (based on time-series of course) have shown the presence of brain waves. This is not the purpose to develop this concept here (maybe in a future post) but the main thing here is to say that we are driven (our whole body from heart to brain) by rhythmic activities. Thus it seems relevant that we are sensitive to rhythmic structure composing what surrounds us.Repetition is everywhere. Despite this, it was not possible to repeat a temporal object before 1877 and the invention of the phonograph by Thomas Edison. Even the type of music called “modern classical” that is explicitly made to avoid repetitions has some in it. Moreover, if you artificially add some repetitions in this music, human find it more enjoyable (it has to be said that contemporary classical music is quite hard to ear). Brain is prime to search for meaning and patterns in the world. Repetition infer meanings. This has to be linked to how the brain works. Indeed, the information in the brain comes from neurons that have an electrical activity. Recordings of this activity using EEG techniques and analyses (based on time-series of course) have shown the presence of brain waves. This is not the purpose to develop this concept here (maybe in a future post) but the main thing here is to say that we are driven (our whole body from heart to brain) by rhythmic activities. Thus it seems relevant that we are sensitive to rhythmic structure composing what surrounds us.
Coming back to our topic, when willing to collect time series data one have to keep in mind their characteristics. Mainly 3 parameters are very important:
Resolution: Number of data sample by unit of time.
Precision: certainty of measurement at each time point.
Accuracy: Relationship between signal and timing of the effect we want to predict.
Their amplitude and frequency mainly. On another hand there are some rules that has to be followed to capture enough data to render the willed effect. In order to do that, there is a theorem coming from sirs Nyquist and Shannon. This theorem is called the sampling theorem and comes from the telecom world.
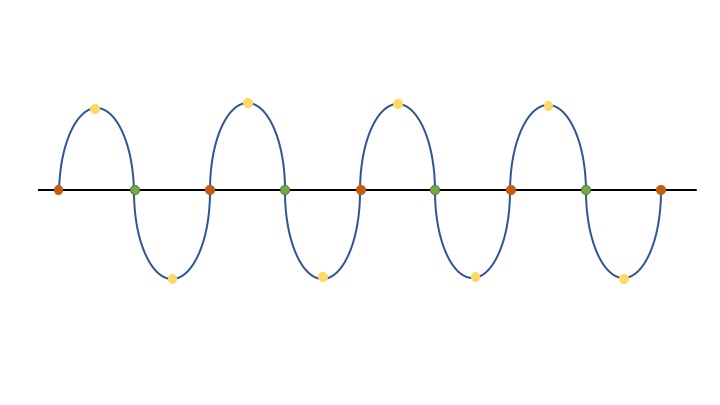
Nyquist did theoretical work on bandwidth requirements and realised that if he wanted to spot the relevant information from a signal, he needed to sample it at, at least twice the frequency of the actual information he was looking for. This sampling theorem is fundamental to make a link in between continuous and discrete signals.
In the picture below, one can see that sampling the signal using the orange dots does not allow to render the signal’s information. Indeed, the samplig is at the signal’s frequency. Then adding the green dots doesn’t change anything. (Orange + green = 1.5 the frequency). But, adding the yellow dots to the orange ones render the signal’s complexity.
These physical characteristics of the signal has to be taken into account at the very beginning of the project when choosing the sensor used to measure our data.
Let’s take an example. ECG or electro cardiogram is a measurement of the voltage in the heart. It is the reflection of heart contraction. Let’s consider that your heart beat every second (which is pretty good). Considering what we just saw about Nyquist theorem, you would think that sampling twice a second would be enough to catch the relevant information in the signal. If you think so, you’re wrong and you’ll miss most of the relevant info. Indeed, ECG is made of several peaks, each having an importance for a cardiologist willing to identify a pathology. Below a picture of a heart beat and the duration of each single phase composing it.
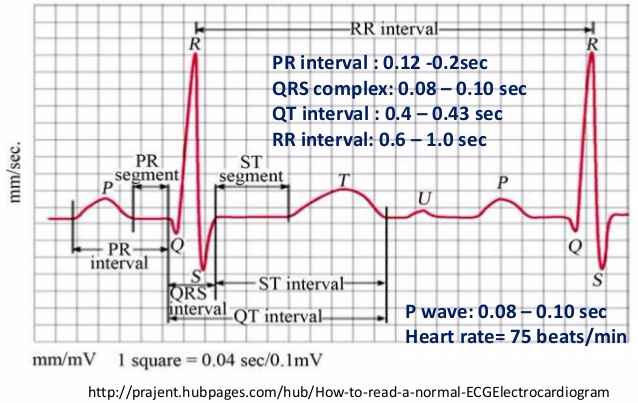
Looking at it, it seems like the sampling rate shouldn’t be slower than 20hz. Ten times the 2Hz we were considering before right? The sampling theorem solves the “resolution” characteristic of data.
Now that we have a sensor delivering the data at the proper frequency, we should consider how this sensor is delivering the data. This can have an effect on precision of the signal and on its accuracy.
Let’s consider precision first by re-using our heart beat example. Looking at the picture again we see that the difference between the higher and le lower point is of 1mV approximately. Moreover, the smallest peak amplitude seems to be of 0.03 mV. Knowing this, the sensor need to be precise enough to capture this effect.
Last but not least, the accuracy of the measurement. It is common that sensors embed some pre-processing algorithms. Those algorithms can thus have an effect on the data and even if one cannot avoid it, this has to be taken into account when analysing the data. Those processing usually consist in different kind of filtering (generally for 50Hz that can be considered as noise) or normalization of the data. It is very important to look at the manufacturer’s manual in order to be aware of the algorithms used and take their effects into account in the processing and interpretation of the result.
All this seems quite trivial and logic but if I took time to talk about it, this is because despite the small number of projects I had as a data scientist, I faced all these situations at least once.
Now that we know how the data are collected and everything is under control, It’s time to process them.
Despite all the efforts put in the collection phase, the signal is not pure and ready to be processed and analysed. Indeed several things that you cannot control can occur. When dealing with movements, it is almost sure that your sensors will have some unwilled movements. In this condition, this is you and the persons to whom you are doing the analyses that will have to account for the importance of these movements. Are they part of the real conditions that will make your model better generalize later or are they parasites that will prevent your model to fit at first? This question is quite tricky to answer and have to be considered. Are the environment alteration of the signal part of the relevant information? Do you need to filter those information? If yes, some deeper analyses have to be done, involving Fourrier transform among them in order to find the different frequencies held by your signal and their power. Maybe then perform so filtering to attenuate unwilled effect of one component of the signal.
Then maybe your signal doesn’t come from one sensor but several sensors. If you wish to monitor heart beat at the same time than the subject activity, you might have 2, 3 or even more sensors. What then?
Considering you’ve done all we’ve already discussed while colelcting and processing the data, there is an other step: synchronization. This can be though at the collection moment to ease the post-processing. If not, there are still some solutions to synchronize the data afterward. Then, there are several points to adress. Indeed, if you’re processing the data to build a model that will make predictions, it is likely that the way that you’ve collected the data is the way you will use your system (maybe real-time) to collect new data in order to make predictions. In both cases you should do the same post-processing on your data for learning and inference otherwise the model will not be able to perform properly. Nevertheless, there are things you can do when doing batch processing (understand not real-time) that would be impossible in real-time. Indeed, when synchronizing data for batch processing, you can rely on passed and future data to get the data from a given time point. This is not possible for real-time data, where usually, the last avalable data is kept until update by a new one.
| timestamp | data1 | data2 | sync batch | sync real time |
|---|---|---|---|---|
| 0 | 0.01 | … | … | |
| 0.1 | 0.25 | 0.4 | 0.4 | 0.4 |
| 0.2 | 0.5 | 0.5 | 0.4 | |
| 0.3 | 0.75 | 0.6 | 0.4 | |
| 0.4 | 1 | 0.7 | 0.7 | 0.7 |
| 0.5 | 0.66 | 0.5 | 0.7 | |
| 0.6 | 0.21 | 0.3 | 0.7 | |
| 0.7 | -0.02 | 0.1 | 0.1 | 0.1 |
| 0.8 | 0.33 | … | … |
Looking at this table it seeems more obvious that the effect on the data is not negligible. By extension it seems more obvious that a model trained on batch synchronized data will under perfrom on real-time data.
The take home message here is that as a data scientist, you will have to handle data coming from different sources. Even if some projects are close to each other, they all have their characteristics. One essential point is to talk to the experts you are working with (generally your client) and to be sure to understand the physics behind the data and the purpose of what is asked to you. Which goal do you serve?
Hoping that you’ve survived along this long post, feel free to give any insight about what you’ve encounter and your own experience. Next step? Trying to use all this in a machine that learns either for prediction or for classification. 😉

Leave a comment